Birthday Graphs
This week in class we were making graphs about the number of birthdays per month fo the people in our class. We had to do multiple drafts, making each one better with feedback from our peers and teacher.
-
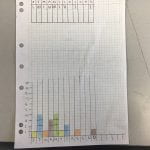
- Graph 1
-
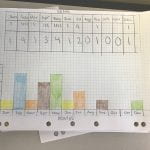
- Graph 2
The first image is of my first graph, and because I was thinking about making it look fresh, I left too much of a space, so it looked like it was too small. I think I tried hard for this first draft, but it wasn’t my best work. The second image is of my second graph, which I made bigger, so it looked more full, as in it took up more of the page. I changed my thoughts because I had the feedback that it. Was a bit small, and that I hadn’t labelled the axis. I feel like this was a sample of a bit of my best work, and I am proud of it. In making these graphs, I learnt how to make things better, while in a way, keeping them the same. In the comments, please let me know which one you liked better, and any feedback you might have.
Thanks, Sophie 😎
I like the second draft because you picked up on the feedback you got. Also, in this post you have a full stop where there isn’t supposed to be one – can you find it?